Instructor's Manual for Unit VI, Social Inequalities
Prepared by Caroline H. Persell, New York University, September 2008, with early input from Margaret L. Andersen, University of Delaware; David Karen, Bryn Mawr College; and Stephen F. Steele, Anne Arundel Community College

Sociology has a long history of investigating and teaching various kinds of social inequality, including economic inequality, racial/ethnic inequality, gender inequality, and inequality by other social characteristics such as age, sexual orientation, or disability.A good starting point would be the unit page for Social Inequalities and the discussion in the ASA Task Force's draft Curriculum.
Economic stratification (structured inequality) needs to be defined, and the distinction between inequality based on earnings and inequality based on ownership of wealth and productive resources needs to be made. Many textbooks do this, but some ignore issues of wealth ownership and focus mainly on income. One possible source is the introduction to Persell’s chapter, “Social Class and Poverty.” While the data in it are dated, the conceptual distinctions may still be useful.
The U.S. Census regularly collects data on family income, including household income and shares of family income earned by different fifths of the population from 1967 to 2005. Students might be asked to graph the share of household income earned by each fifth (quintile) over that time period, to understand how the distribution of income has shifted. They could then compare their work with that of others.
Understanding the origins and maintenance of economic inequality involves grasping the underlying rules and laws governing property and exchanges, whether of labor, goods, or services. These are abstract and fairly hidden ideas and processes. Many instructors try to help students see beyond explanations rooted solely in individual drive and ability by using games or simulations. Many good articles about teaching class stratification have appeared in Teaching Sociology. Some of them (Abrahamson 1994, Bordt 2005, Brewster and Fulkerson 2005, Brezina 1996, Brislen and Peoples 2005, Coughlan and Huggins 2004, Fisher 1992, Miller 1992, Misra 1997, Nicholas and Kalogrides 2004, Simpson and Fischer 2000, Stone, and Wright and Ransome 2005) are listed in the bibliography.
Games are activities guided by rules and simulations are games representing particular slivers of reality (Jessup 2001).
Some good examples are:
“Sociopoly: Life on the Boardwalk” by Michael M. Jessup in Teaching Sociology January 2001 (29: 102-109). A modified version of Sociopoly was used and studied in a focus group by Persell and Mateiro. Jessup also raises some discussion questions linking the game to theories of Karl Marx and Max Weber.
Edith M. Fisher’s “USA Stratified Monopoly: A Simulation Game about Social Class Stratification,” Teaching Sociology July 2008 (36: 272-282).
Life Happens: A Work, Class, and Access to Resources Game created by Tracy E. Ore.

Star Power is a simulation of a society with three classes, where the top class gets to make the rules (see rules).
“It’s up in the Air, or Is It?” a simulation by Linda A. Renzulli, Howard E. Aldrich, and Jeremy Reynolds,” Teaching Sociology January 2003 (31:49-59), with a discussion of how to use it and instructions for doing the coin toss simulation. Their paper also contains a good discussion of Kingley Davis and Wilbert E. Moore's functional theory of stratification.
A very concrete exercise with an instructor's manual is “Stratification, Social Class, and the Distribution of Income” (or “the Brownies Game”) from James Sikora and Teodora O. Amoloza (eds.) 2001. Pp. 204-205 of Introductory Sociology Resources Manual. Fifth Edition. Washington, DC: American Sociological Association Teaching Resources Center. The sixth edition of this book is available at the ASA online bookstore.
Another exercise acquaints students with the hidden rules of living in poverty, in the middle class, or the upper class.
The Wisconsin Institute for Poverty Research is a good source of data and conceptual clarification about poverty. The home page has links to Who is Poor? How Many Children Are Poor and What are Poverty Thresholds and Poverty Guidelines? The poverty rates of different counties can be viewed nationally using CensusScope. There is an exercise for students, in which they can explore data on poverty in their counties.
The National Center for Children in Poverty at Columbia University medical school has a website with links to their publications, policy discussions, and a useful button to data tools to analyze income needs, policies in different states. See the 50-State Demographics Wizzard button on the tools page. It allows you to make tables comparing, for example, what percent of children with parents at different educational levels live in poverty or above the poverty level in different states. The Children’s Defense Fund has a series of webpages containing data on children, childcare arrangements, poverty, primary caregivers, and other issues. The Annie Casey Foundation has the KIDS COUNT Data Center containing state- and city-level data for over 100 measures of child well-being, including all the measures regularly used in their KIDS COUNT Data Book and The Right Start for America's Newborns. This online database allows you to generate custom reports for a geographic area (Profiles) or to compare areas on a topic (Ranking, Maps, and Line Graphs). It also has some data broken down by race/ethnicity and immigrant and language status of children.
 |
Some data on international income distributions can be found in the CIA World Factbook which provides measures of the degree of inequality in various countries (using the gini coefficient) The CIA World Factbook also explains what the gini coefficient is (at the top of the page). |
|---|---|
 |
The website for the Luxembourg Income Study (LIS), while aimed primarily at researchers, allows the public to access their international datasets through their LIS Key Figures. The LIS recently began a study of wealth inequality in various countries. |
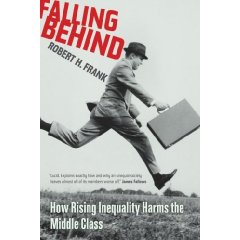 |
Students might discuss how tax policies and deregulation of markets might have contributed to changes in income distributions over the past 40 years. They might also consider what the consequences of increasing income inequality are for a society. One interesting source is Robert H. Frank’s 2007 book, Falling Behind: How Rising Inequality Harms the Middle Class. Berkeley, CA: University of California Press. |
 |
The 1990 film Roger & Me by Michael Moore, although a bit heavy-handed, rather powerfully shows how high level corporate decisions can negatively impact an entire city, independently of the efforts of the people who live there. |
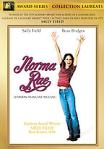 |
Other films that help to convey what it is like to live in different social classes and how people respond to their situations are Norma Rae by Martin Ritt (1979) about a woman millworker in the U.S. who becomes a union organizer and People Like Us by Louis Alvarez and Andrew Kolker, 2001 (see Film References).
There is an excerpt from People Like Us on YouTube. |
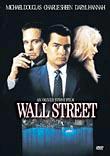 |
Oliver Stone’s 1987 movie, Wall Street, (see excerpt) illustrates the conflict between greed and social values. |
 |
Enron: The Smartest Guys in the Room, Alex Gibney’s 2005 documentary of life behind the scenes of the powerful energy company that collapsed, are two movies that capture some sense of what can happen when markets are left to police themselves. |

Chad Hanson discusses how to use depression era photos to help students think about how social contexts influence individuals (Teaching Sociology, April 2002). In the case of the Great Depression of the 1930s, a key factor was the foreclosure of mortgages on farms in many parts of the U.S., forcing many people such as the woman in this photograph to leave their land and become migratory workers.
Racial/ethnic inequality deals with stratification based on race, ethnic group membership, national origin, religion, or language. Like class (economic) stratification, a first step is to understand some key terms, particularly the concept of race. A very useful reading by Michael A. Omi is "The Changing Meaning of Race" (pp. 243-263 in Neil J. Smelser, William Julius Wilson, and Faith Mitchell, Eds., America Becoming: Racial Trends and Their Consequences, Vol. I. Washington, DC: National Academy Press) may be read for free online. This chapter provides excellent background for instructors or advanced introductory sociology students. Students can do a data exploration exercise to learn the proportions of U.S. residents of different racial and ethnic groups.
Using CensusScope, students could explore which counties in the U.S. have the largest percentages of individuals of multiracial backgrounds. CensusScope can also be used to see how socially defined racial groups are distributed at the regional, state, and county levels of the U.S.
An excellent exercise that may be done in class is described by Brian K. Obach in “Demonstrating the Social Construction of Race” in Teaching Sociology 27, July 1999:252-257. Obach’s figure makes a useful class projection or handout. Even though race is not a biologically distinct trait, racial classifications have been very real in their consequences and data on racial groups is collected in the U.S. and some other countries as a way of monitoring progress toward parity of historically disadvantaged groups.
Racial/ethnic inequalities are evident in data on family incomes in 2005. Students could be asked what might explain some of the observed differences (such as number of earners per family, educational levels, occupations, or other factors). Individual earnings by educational level, race/ethnicity, and gender reveal that both education and ethnicity are related to earnings. These data also need to be critically scrutinized. What else might vary by race/ethnicity (e.g., age of workers, occupations, language facility, or other characteristics)?
The racism review website is well-indexed and contains blogs on many facets of racism rooted in research and scholarship.
Several films illuminate facets of racial stratification. Race: the Power of an Illusion explores the origins of racial categories in the U.S., the biological evidence suggesting that racial differences are very small and superficial, and some of the consequences of a rigid system of racial classification and evaluation.
The Color of Fear presents a series of encounter groups among males of different races that explores their highly charged emotions on the subject of race. (See excerpt on YouTube.)
Eyes on the Prize is a multi-part documentary on the civil rights movement in the 1960s.  See especially Part I (excerpt from YouTube)
and Part IV (excerpt from YouTube).
See especially Part I (excerpt from YouTube)
and Part IV (excerpt from YouTube).
To help students understand Gender Inequality, Bidwell (1995 Teaching Sociology) has them analyze personal experiences and social events in their writing. Cross created an exercise where students analyze the ways gender is learned an reinforced my material culture. Gerdes collected a series of gender images from the web using Google images. Students can analyze those images or collect their own.
The Census Bureau reports data on earnings by gender and race/ethnicity, but several points need to be noted about these data. First, there seems to be a typo in footnote 2. Second, the data are reported as raw numbers rather than percentages, but the total number of women (at the top of the columns on the right side) is greater than the total number of men in different racial/ethnic categories, so the raw numbers are somewhat misleading. Students could be taught and asked to compute percentages from these numbers (by dividing the number in each income cell by the total number in the column). They could then present the data as percentages, and possibly graph them. An excel file with the data can be downloaded from this census site. Students could reflect critically on the data. What other factors might vary between men and women that are related to earnings (e.g., educational levels and fields, occupations, hours worked, age, or others)? Income data can be analyzed by gender and educational level. Occupational breakdowns by gender are available in CensusScope and can be examined nationally, by state, or by metropolitan area.
The Women’s Bureau of the U.S. Department of Labor contains links to research and data on women in the labor force (see especially the Publications and Statistics buttons in the right column under Resources & Info), the Institute for Women’s Policy Research website contains research and news about policy issues, the Feminist Majority website pulls together research, policy, and action in many fields. Menweb is a website presenting men’s voices on gender-related issues.